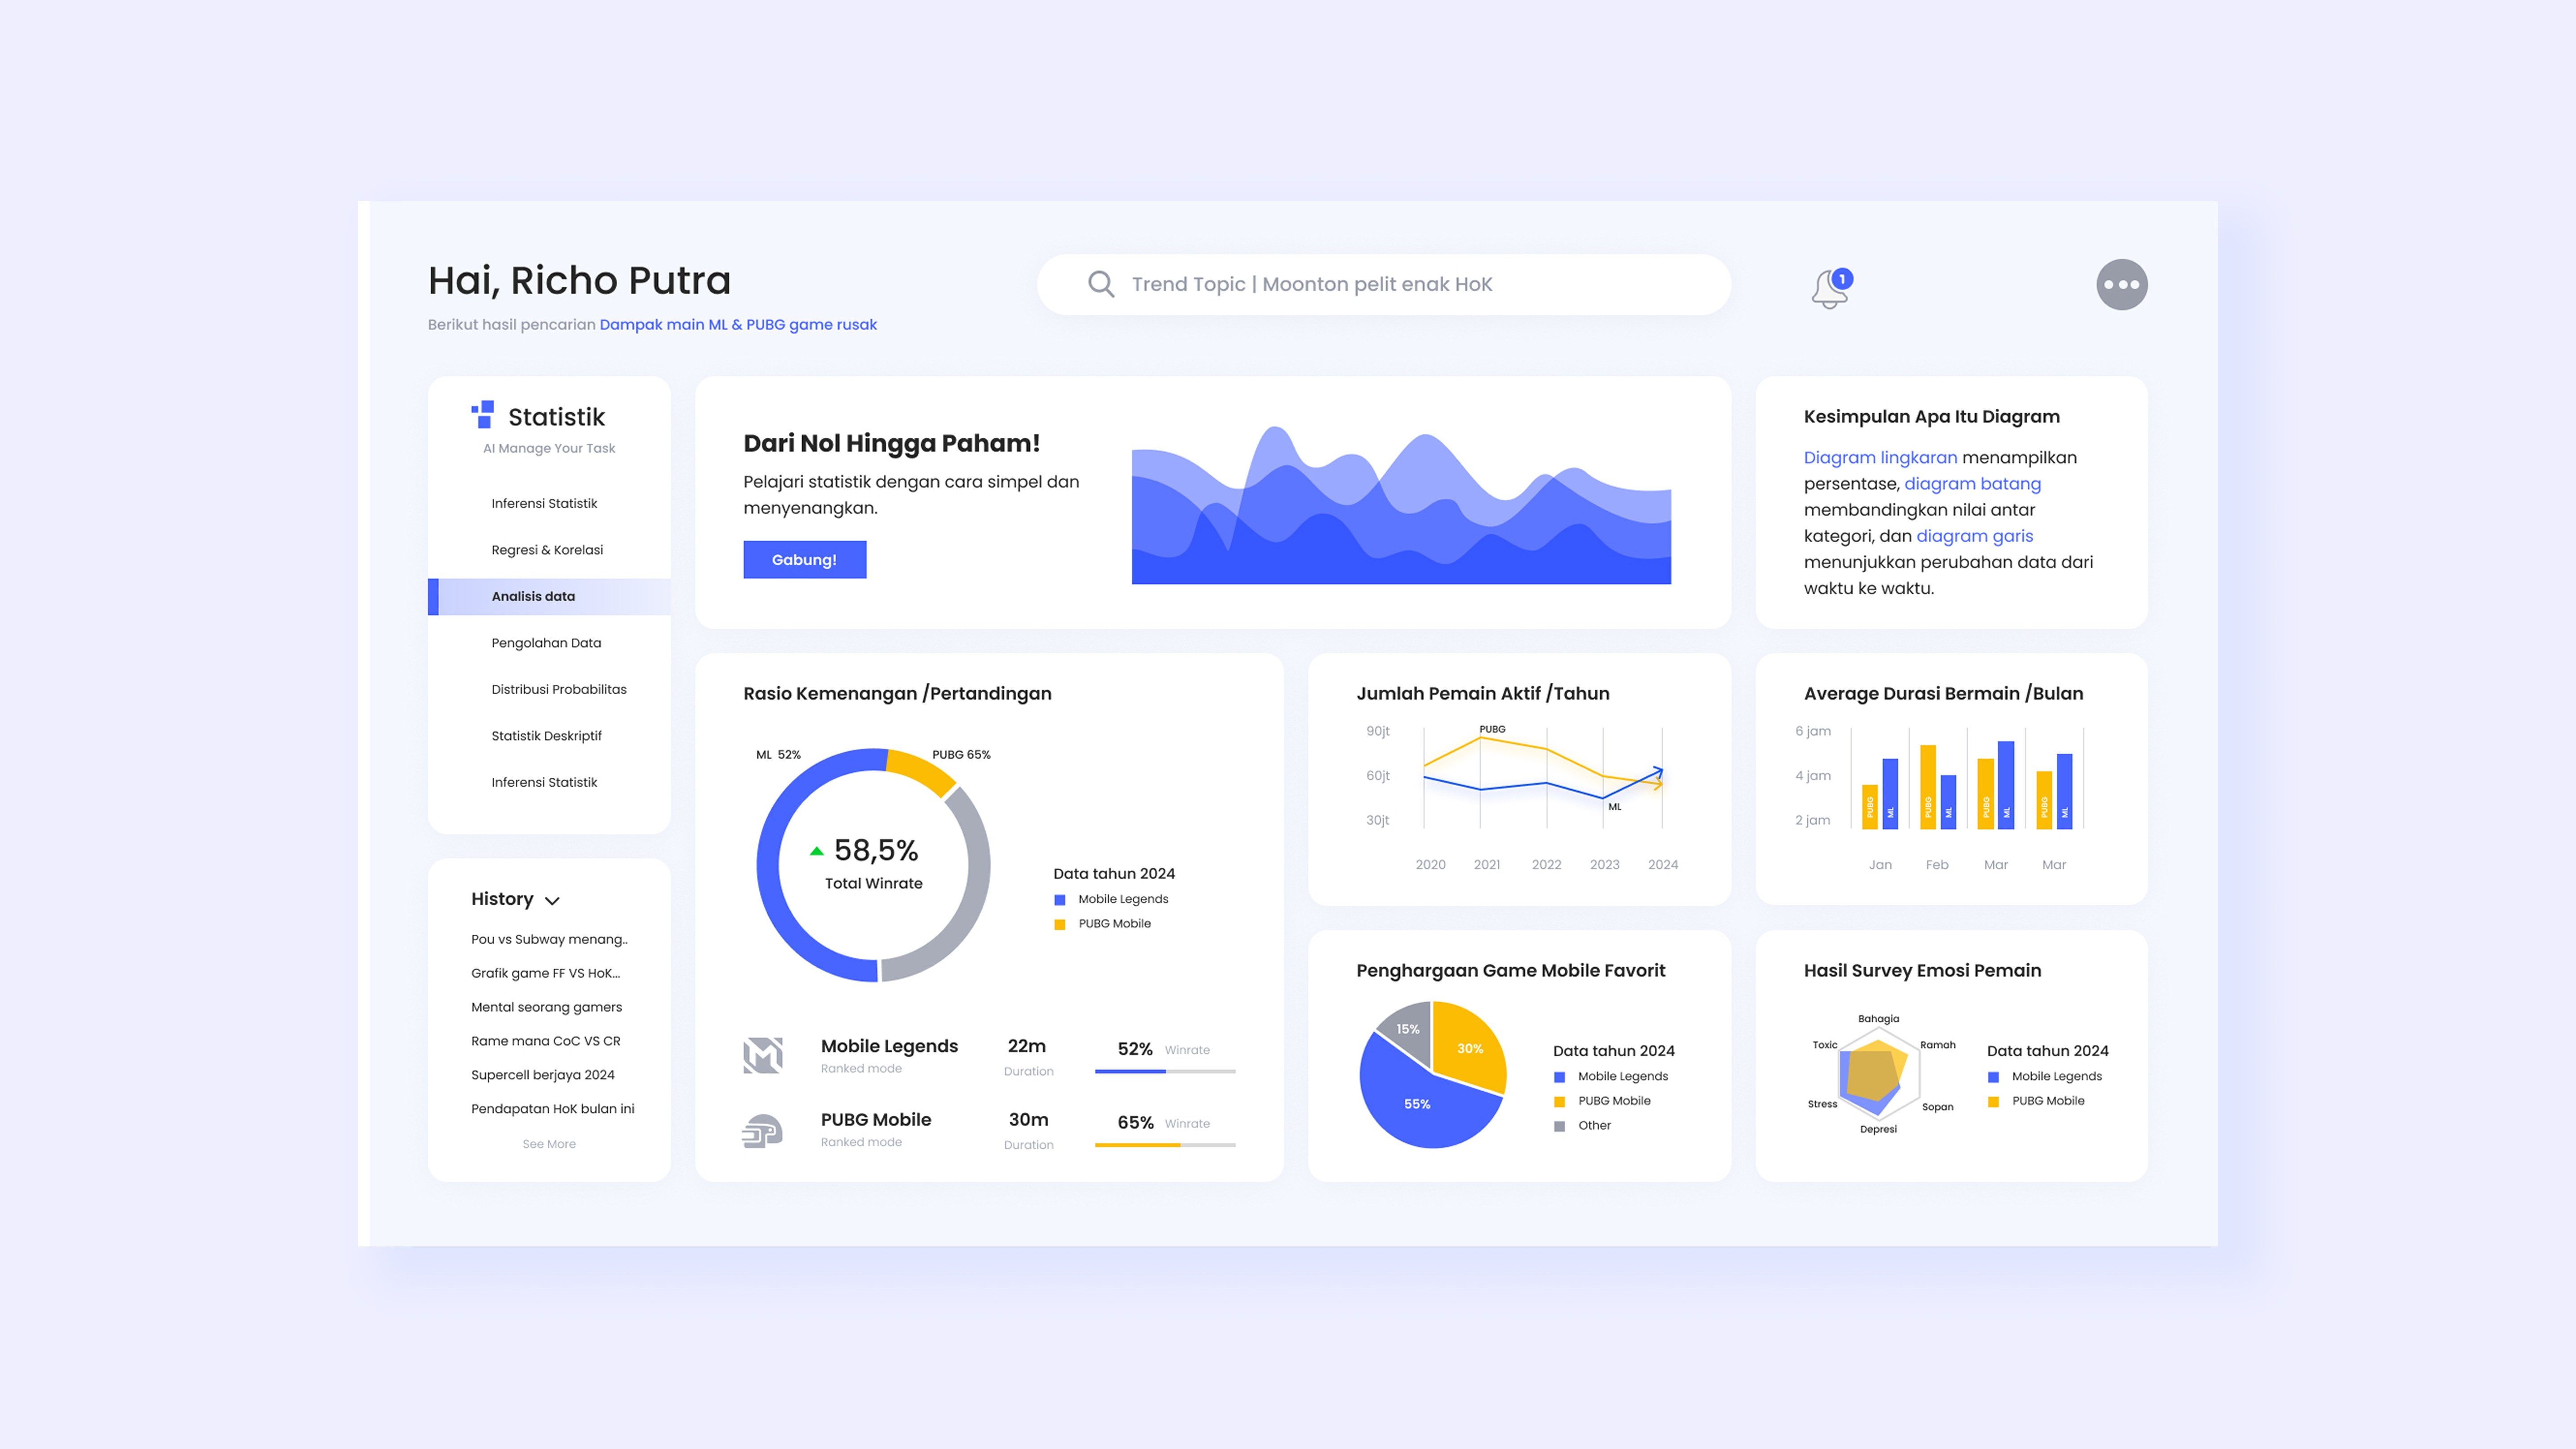
This dashboard design presents data analysis related to Mobile Legends and PUBG Mobile statistics. With a modern and clean interface, it visualizes various metrics such as win rates, active player counts, and play duration through pie charts, bar graphs, and line charts. Additionally, the navigation features allow users to explore statistical data effortlessly, making the learning experience more interactive and engaging. As a graphic designer specializing in UI/UX, this design showcases your expertise in presenting complex data in a clear and user-friendly manner. Is this part of a UI/UX project you're currently working on?
This dashboard design presents data analysis related to Mobile Legends and PUBG Mobile statistics. With a modern and clean interface, it visualizes various metrics such as win rates, active player counts, and play duration through pie charts, bar graphs, and line charts. Additionally, the navigation features allow users to explore statistical data effortlessly, making the learning experience more interactive and engaging. As a graphic designer specializing in UI/UX, this design showcases your expertise in presenting complex data in a clear and user-friendly manner. Is this part of a UI/UX project you're currently working on?
Year
Year
2024
2024
Service
Service
UI/UX Design
UI/UX Design
Category
Category
Infographic Design
Infographic Design
Tools
Figma


Subscribe🎇
Subscribe🎇
Subscribe To Get Latest Update From Me
Subscribe To Get Latest Update From Me

Richoputra_
COPYRIGHT © 2025 Richoputra_ ALL Rights Reserved.
COPYRIGHT © 2025 Richoputra_ ALL Rights Reserved.
|
Terms of Use
Terms of Use
|
|
Privacy Policy
Privacy Policy